
Two speakers are set a meter or two apart in front of the class. They are driven by an audio oscillator through a stereo amplifier at the same frequency, but the phase of one channel is variable with respect to the other, either using the circuit below, or the two fundamental channels of the Fourier synthesizer, Z.X.1. The phase is varied for the class so each student can hear the difference between constructive interference (loud) and destructive interference (soft). Then the phase is set at zero and all the students hearing a loud tone are asked to stand up, displaying the interference pattern across the lecture hall.
This demonstration occasionally produces erratic results in the lecture halls because of reflections from the walls. It works well in the anechoic chamber, but then you can take in only 10 - 15 students. A visit to the anechoic chamber and reverberation room would be very nice for a small class.
Ultrasonic Acoustical Interference - Small piezoelectric transducers (barium strontium titinate) resonate at 40KHz and can serve either as speakers or microphones. Two hooked to the same signal generator produce a very pretty interference pattern, which is read out by a third on an oscilloscope. Also the speed of sound can be measured by using one as a transmitter and a second as a receiver several centimeters away. The received signal is displayed on an oscilloscope synchronized to the transmitted signal. From the distances between phase coincidences and the frequency, the speed of sound can be computed.
Two tuning forks, one of which is adjustable in frequency, demonstrate beats. If the two tuning forks are adjusted to the same frequency and set next to each other, striking one will set up vibrations in the other.
There is a good computer demonstration of beats, which closely represents the tuning fork demonstration above. Two sources are created which play through the room speaker. The wavelength can be changed by dragging and the effects heard. At the same time, the beat waveform or the frequency spectrum can be viewed. This provides a couple different ways to visualize the beats.
The beat bars, tuned to 435 and 440 Hz, produce loud, definite beats. A strong effect is also produced by activating two Rijke Tubes of slightly different lengths. (See Rijke Tubes [2])
Another good demonstration beats consists of two audio oscillators hooked through a stereo amplifier to speakers. The summed signal is also sent to an oscilloscope so the wave envelope can be seen.
This standard demonstration which shows that sound is not transmitted by a vacuum has been improved by Prof. Rudnick. A sound transmitting seal over the vacuum jar has been provided so that the bell can actually be heard before the jar is evacuated. Circuitry built by R. Keolian rings the bell in bursts and simultaneously flashes a light so that the students can see that the bell is still ringing after the jar is evacuated and they can no longer hear it (and also note that light is transmitted by a vacuum, even though sound is not!).
Some have pointed out that this demo is not really what it seems. Sound travels very well in a poor vacuum, as long as the mean free path for collisions of air molecules is much less than the size of the container. For pressures achievable with the roughing pumps we use, about 1/10,000 of atmospheric pressure, the mean free path is about 1 mm. The speed of sound is proportional to the square root of the pressure divided by the density. Since the density is proportional to the pressure, the velocity of sound is independent of pressure.
So why does the sound diminish as the air is pumped out? It is a problem of the impedance match between the air and the bell and the air and the glass. The impedance of the air is proportional to the square root of the product of the pressure and density. Pumping out the air reduces the impedance of the air by a factor of 10,000 and the vibrations of the bell are not coupled to the air. If there was sound in the remaining air, it would not couple to the glass but instead be reflected at the interface.
This demonstration requires a fair amount of equipment. A stereo amplifier, whose output goes to a horn driver near the wine glass to be broken, can be switched between a frequency generator, easily tuned through a broad spectrum, and a frequency synthesizer which can generate a?very accurate frequency. The response of the wine glass to the sound is monitored with a microphone connected to an oscilloscope. The first four steps can be prepared before the lecture, but most instructors like to run through them with the class so the students can see the entire operation.
We have the Tacoma Narrows Bridge collapse on videodisk. There is also a good online version which you can link to. The link is clickable Tacoma Narrows Bridge Story http://youtube.com/watch?v=ASd0t3n8Bnc [3]
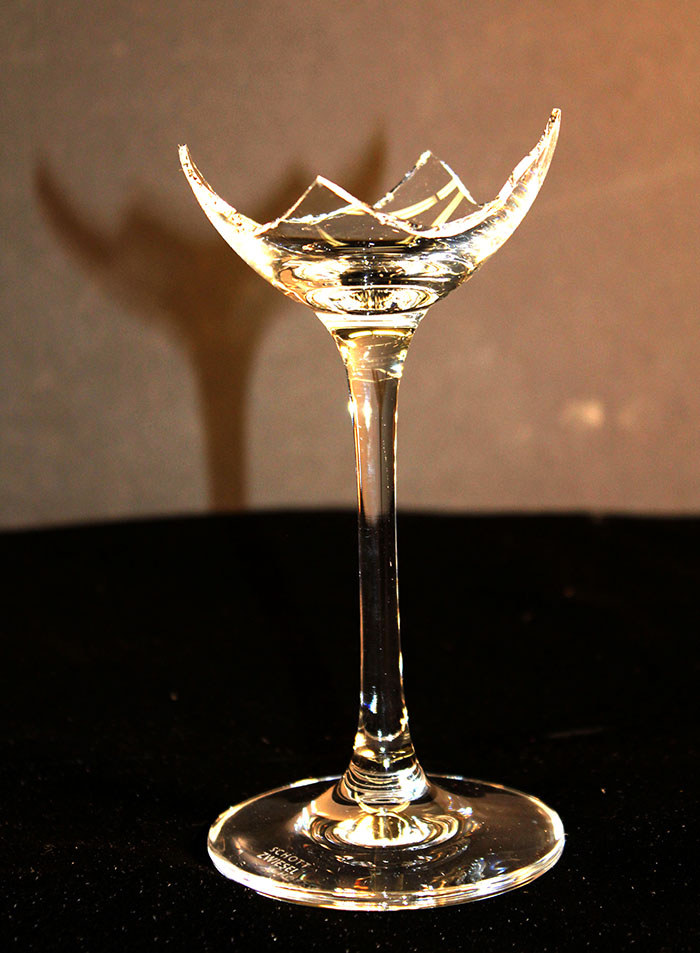
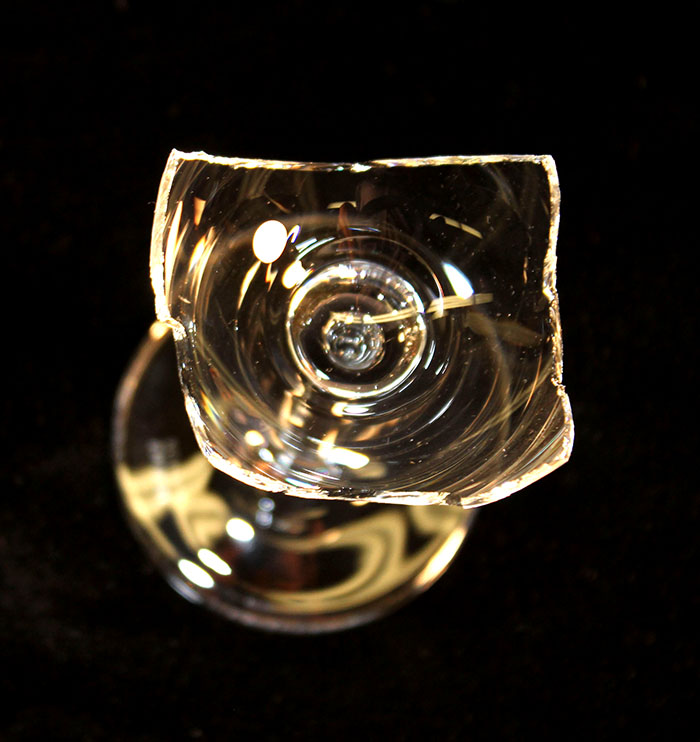
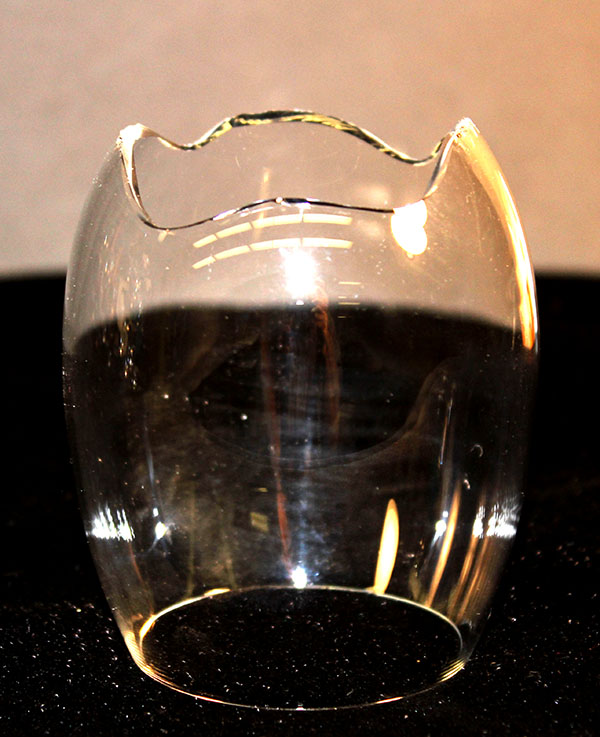
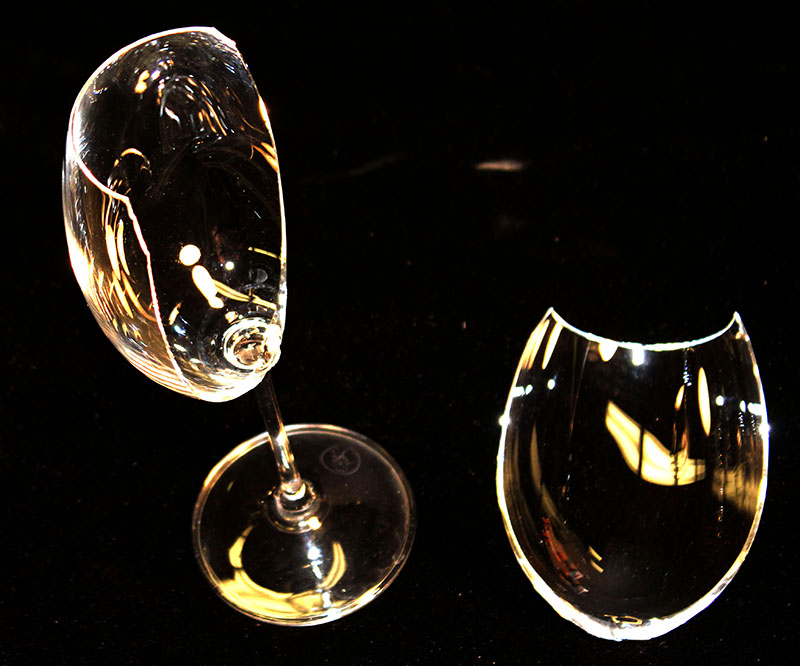
The fundamental resonance of a wineglass is the bell mode which can be seen in the strobed video above. Two wavelengths of the resonant frequency fit around the rim, travelling in opposite directions, constructively and destructively interfering. There are four nodal points along the rim of the glass which don't move. In between the nodal points the glass walls are moving back and forth. Sometimes when the glass shatters it leaves evidence of the nodal structure as seen in the gallery below. The last two are rare breaks.
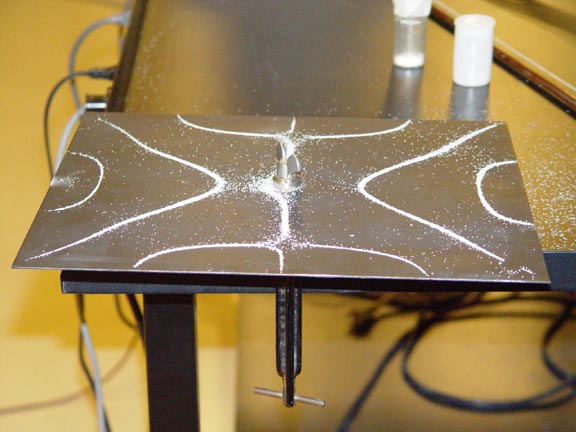
Exquisite patterns emerge from salt scattered on a metal plate which is stroked with a bass fiddle bow, illustrating two dimensional vibration. A video camera will enlarge the patterns for the class to see in the Knudsen lecture halls.
To form patterns, hold your fingers firmly on the nodes indicated, but try to localize them as much as possible. Use plenty of rosin on the strings and bow firmly. You are bowing on anitnodes; as you go from pattern to pattern, bow on a node of the previous pattern. That way you eliminate the previous one. a well bowed pattern gives a pure tone. And finally, practice, practice, practice!
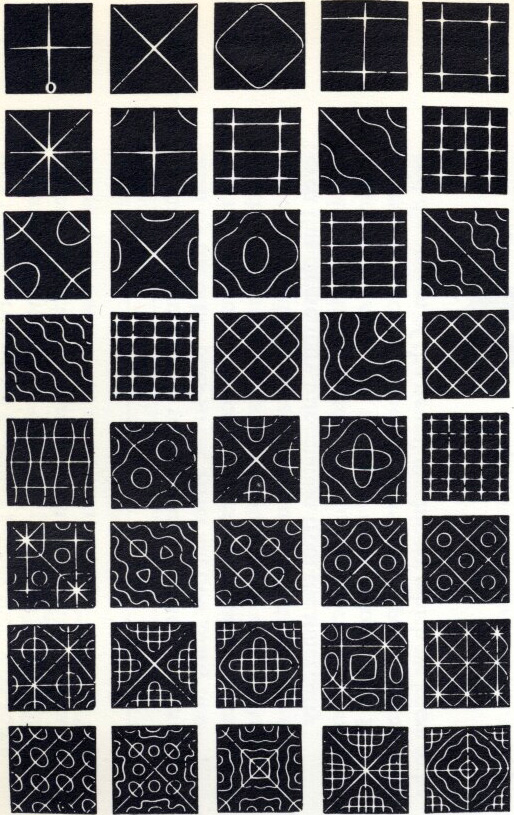
Chladni patterns can also be formed by using circular or rectangular metal plates on a mechanical driver controlled by a signal generator. This method avoids having to practice your bowing. The patterns are now different since they have antinodes at the center (which is being vibrated) rather than nodes with the center rigidly attached and the edge bowed.
 [5]
[5]
The Doppler effect for sound waves is dramatically demonstrated by swinging a ringing tuning fork around your head.
The whistle ball is another good way to demonstrate doppler shift. A sponge ball has been stuffed with a battery operated whistle in its core. As the ball is thrown around the lecture hall, the students hear a shift in the ball's frequency.
A sound clip is available indicating the doppler shift of a car horn at 30 MPH [6]. The link is http://www.exploratorium.com/imagery/sounds/30_MPH_doppler.au
The animated applet below is a good way to visualize the doppler shift. Click in the box below and then allow the applet to run. Click on the run button. You can control the speed of the source. The applet is also available on our ephysics site [7].
The picture below shows boat wakes which occur when the boat moves faster than the speed of water waves. Compare this to the ephysics applet when the source moves faster than the speed of sound.

Also dramatically demonstrates acoustical standing waves.
Small "balloon" flasks serve as Helmholtz resonators. When they are placed near a small speaker connected to an audio oscilator, the resonant frequency is very apparent as you tune through. The ejecting air will blow out a match. The resonant frequency will also be sounded if you blow over the opening as when producing a note from a bottle.
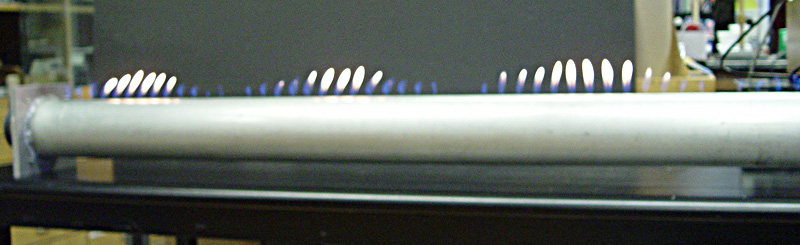
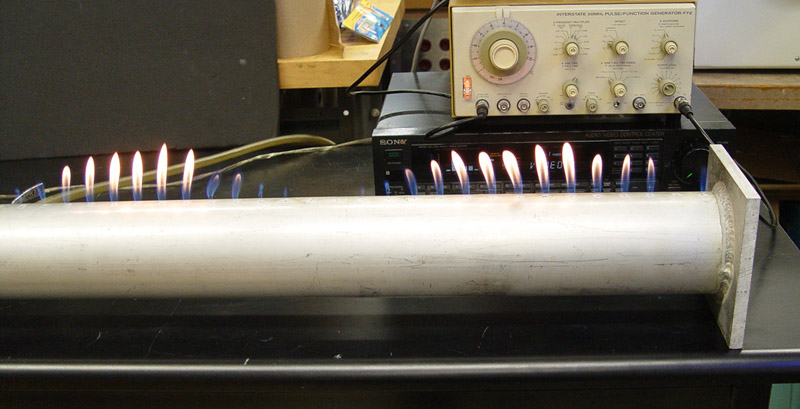
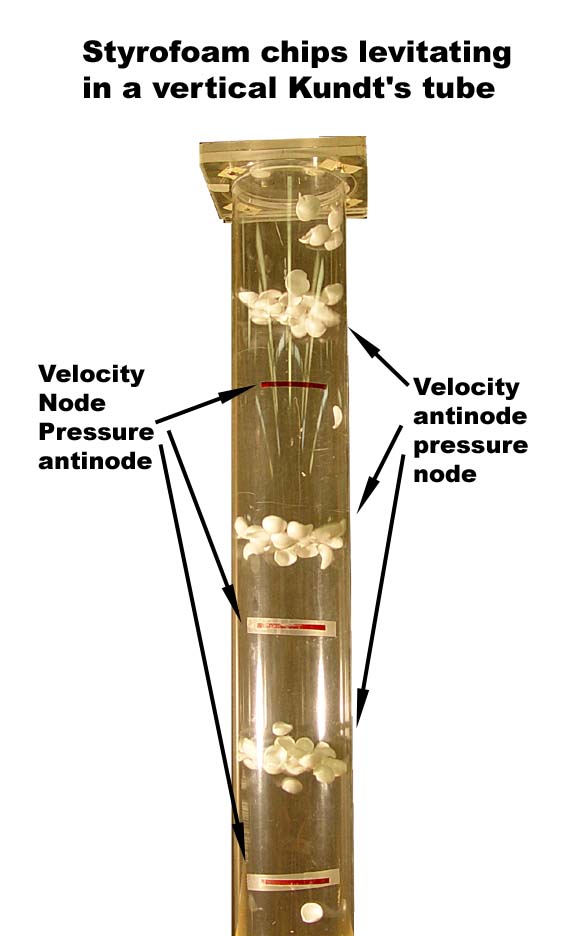
Our large Kundt's tube, designed by Prof. Rudnick, dramatically demonstrates standing acoustical waves. See the animation of standing waves [8] in the waves section of the demo manual. Additional demonstrations and accessories with this apparatus are:
Several large metal tubes ROAR impressively when held vertically over Meker burners. The heat maintains the open-end acoustic standing wave mode (about 100 Hz).
A "Magic" Rijke tube has a wire gauze inside about one quarter the way from the bottom. Keeping the gauze concealed from the class, heat it red hot by holding it over a Meker burner on the floor. The tube will ROAR for some time after being removed from the flame from the stored heat. You can "tip the sound out" by tilting the tube horizontal, or block it by placing the lower end on the floor, and the ROARing will restart when the tube is vertical away from the floor if the gauze is still hot. Also, if you "tip the sound out", and then run across the classroom with the tube horizontal, bottom first, the ROARing will restart.
Heat up the magic Rijke tube, hold it away from the flame so it ROARS with the retained heat, and hold the normal tube over the flame. The tubes beat in their ROARing since, although they have the same lengths, they have slightly different diameters.
Rijke Tubes and Variable Stars
Similar to the standing sound waves exhibited in the case of the Rijke tubes, the pulsation mechanism for variable stars such as the Cepheids can be understood as a resonance of pressure waves of a particular period in the interior of those stars.
In the case of the Rijke tubes air can move in and out of both ends. A heated metal mesh placed a quarter of the way up from the bottom heats the air flowing past it. This flow of air is a combination of the convection current caused by the transfer of heat from the metal mesh and the sound wave that is set up for the condition of two open ends. For half of the oscillation cycle of the sound wave air moves in from both ends as it flows towards the center generating a pressure antinode (displacement node) there. Even though some of the air moving past the hot metal mesh has already been heated during the cycle prior to this, some additional cool air flows in, passing through it and acquiring thermal energy and further increasing the pressure, thus reinforcing the oscillation. For the remaining half cycle air passing by the metal mesh while flowing outward from the center of the tube is already heated and therefore energy transfer is minimal.
In the case of a Cepheid variable star, the partial ionization occurring in a He envelope allows for an increased opacity with increasing pressure, and is responsible for setting up the pulsation mode. The stage when the opacity is increasing corresponds to the part of the vibration cycle in the case of the Rijke tube when energy is transferred and the increase in pressure is amplified.
In both cases analogy can be drawn to an internal combustion engine.
Four small loudspeakers are used to excite standing waves in a plexiglass "room" 40 ¥ 40 ¥ 12 cm high. At 400 Hz one half wave fits in the 40 cm. About 140 dB of sound can be established in the "room". An audio oscillator feeds channels A and B through a stereo amplifier, but one channel is phase shifted 90° to the other. A reversing switch is provided to change the 90° "lead" to "lag". Thus, by using the balance control one set of speakers, or the other, or both, 90° out of phase, can be excited. By engaging the monaural mode the two signals are added, and both sets of speakers receive the same phase signal. A sample set of demonstrations is described below.
This record, produced by Bell Telephone Laboratories, (Folkways FX6136) is available on cassette tape. Single cuts can be played to the class.
Sound vibrations, compression and rare fractions: The Science of Sound has been recorded eight decibels lower than usual so that illustrations of acoustic phenomena can be presented with loudness approximately proportional to their level in nature. Adjust the volume of your phonograph so that the announcer sound as if he were speaking to you in a normal conversation voice. Then, orchestral music and certain other sound effects that would normally be louder than a human voice will sound louder.
The frequency range of the average human ear, sweep tone from 30 to 15,000 PCs.: This recording and the phonograph equipment on which you are playing it are, even more than your ear, limited in their ability to reproduce faithfully very lost and very slow sound vibrations. However, with high-fidelity equipment, you may be able to hear vibrations between about 50 and 12,000 cps. The sweep frequency tone is recorded according to the recommendations of the RIAA. Playback equipment that is equalized for the RIAA curve and operating correctly will reproduce all tones from your loudspeaker with approximately equal power. Differences in the apparent loudness of the various frequencies are due to the characteristics of the human ear. These pitch versus loudness characteristics have been charted by Fletcher and Munson and can be seen in most standard textbooks on sound and acoustical engineering.
How pitch depends chiefly on frequency and is some extent on loudness the subjective nature of pitch: the mel scale. the standard reference for 1000 mels is a 1000 cps tone at 40 decibels above 0.0002 dynes per square centimeter. the mel scale tones on this record are presented at greater intensities so that they can be heard more easily.
Measuring sound intensity; standing waves; the decibel: The average human ear has a maximum range of about 130 decibels between the threshold of hearing below which no sound can be heard, and the threshold of feeling, above which sound intensity becomes uncomfortable. Since the range of ordinary phonographs is limited we have not attempted to demonstrate an intensity range of more than about 40 decibels.
Two instances of the Doppler Effect: (1) observer moving, sound source stationary;(2) observer stationary, sound source moving. (the sounds of racing cards were recorded at the 1956 International Sports Car Grand Prix, Watkins Glen, N.Y.).
Speech accompanied by echo from reflecting surfaces at 500 ft., 200 ft., and 50 ft: How speech sounds in rooms with long, moderate, and short reverberation times. This demonstration was produced in Bell Telephone Laboratories by means of magnetic tape delay devices in combination with a reverberation chamber. So that delay differences could be heard easily, the echoes are recorded somewhat louder than generally experienced. An attempt is made, however, to present the loudness of an echo in accordance with the length of the echo path.
Speech and music with some frequencies delayed in transmission: This demonstration was simulated by using a delay system with multiple recording heads located around a rotating magnetic disc. the sound is split into two bands by high-pass and low-pass electronic filters that have a cross-over frequency of 3000 cps. (The music is a trumpet fanfare by Semmier.)
The fundamental; overtones; harmonics: The lowest frequency present in a sound is called the fundamental, frequencies high than the fundamental are called overtone frequencies. A special tone generator developed at Bell Telephone Laboratories was used to produce the various tones used in this demonstration.
The effect of overtones on sound quality: A factory whistle, a soprano, and a piano are compared with and without overtones. Special low-pass filters with unusually steep slopes of cutoff (150 decibels per octave) were used in this demonstration to eliminate some overtones. Attenuation in the stop band is 55 decibels or greater.
Music and speech with various frequency ranges eliminated: The filters that were used in this demonstration have sharp cutoffs. 250 decibels per octave. Attenuation in the stop bands was 55 decibels or greater. Wedding Day at Troldbeugen by Greig is played by the Bamberg Symphony Orchestra.
The speed of sound is given by v =rad(gp/p). Since the density p is proportional to the molecular weight A at STP, then v = 1/ rad(A) for monatomic gasses. (In comparing with air we also have to take into account the different g.) For a light gas like helium the speed of sound is higher, and more wavelengths can fit in a fixed distance like an organ pipe or human voice box. The pitch is therefore raised by this same factor 1/ rad(A), about 3 for helium. You can breathe some helium and demonstrate the Donald-Duck-like effect, or blow some into an organ pipe to raise its audible frequency.
What gas shall we use to lower the pitch of the voice?- a gas of high molecular weight, but another most important property is that it be non-toxic. Some possibilities are listed below:
| Gas | Molecular weight | Approximate price for 1 mole (22.41) at 99.995 purity |
| helium | 4 | $1 |
| air | 29 | free for now |
| krypton | 84 | $228 |
| xenon | 131 | $550 |
| radon | 222 | trace quantities supplied free in some municipalities |
| sulfur hexafluoride | 146 | $4 |
Radon is the heaviest gas, and, chemically it is completely inert. However, since its longest lived isotope has a half?life of only 3.8 days, sulfur hexafluoride is the gas of choice. This gas is colorless, odorless, tasteless, water-insoluble, thermally stable, non toxic, and non-reactive. As shown in the diagram, the six fluorine atoms completely surround the central sulfur atom protecting it from attack. The strongly electronegative fluorine atoms make this gas very difficult to ionize. It is a much better gas-phase insulator than air; thus, it is used in high voltage electrical switches. You might wish to demonstrate the heaviness of this gas by filling a balloon and then throwing the "lead balloon" across the room.
Our formula above predicts that the speed of sound in sulfur hexafluoride is about half as fast as in air, so the pitch is halved.
Lecture bottles of He are available for demonstration. It is a good idea to allow some breathing space between the demonstrations to make sure you keep getting plenty of oxygen.
Links:
[1] https://demoweb.physics.ucla.edu/node/53
[2] https://demoweb.physics.ucla.edu/node/55
[3] http://youtube.com/watch?v=ASd0t3n8Bnc
[4] https://demoweb.physics.ucla.edu/chladni_sound.mp4
[5] https://demoweb.physics.ucla.edu/sites/default/files/demomanual/acoustics/effects_of_sound/chladni_sound.mp4
[6] https://demoweb.physics.ucla.edu/sites/default/files/demomanual/acoustics/effects_of_sound/30_MPH_doppler.au
[7] http://ephysics.physics.ucla.edu/physlets/edoppler_shift.htm
[8] https://demoweb.physics.ucla.edu/node/65
[9] https://demoweb.physics.ucla.edu/node/66
[10] https://demoweb.physics.ucla.edu/node/62